
Part 2, Monitoring memory usage (ps, sar, svmon, vmstat) and analyzing the results AIX7
Introduction
The most important part of tuning your memory subsystem does not involve actual tuning. Before tuning your system, you must have a strong understanding of what is actually going on in the host system. To do that, an AIX® 7 administrator must know which tools to use and the how to analyze the data that he or she will be capturing.
To reiterate what was discussed in previous tuning documents (see Related topics), you cannot properly tune a system without first monitoring the host, whether it’s running as a logical partition (LPAR) or on its own physical server. There are many commands that allow you to capture and analyze data, so you’ll need to understand what they are and which ones are most suitable for the intended job. After you capture your data, you need to analyze the results. What might initially look like a CPU problem can be properly diagnosed as a memory or I/O problem, assuming you are using the right tools to capture data and understand how to do the analysis. Only when this is properly done can you really consider making changes in your system. Just as a medical doctor cannot treat an illness without knowledge of your history and the symptoms you are experiencing, you also need to come up with a diagnosis before tuning your subsystems. Tuning your memory subsystem when you have a CPU or I/O bottleneck will not help you and it might even hurt the health of the host.
This article helps you understand the importance of getting the diagnosis correct. You will see that performance tuning is much more than actual tuning itself. Some of the tools you will be looking at are generic monitoring tools that are available on all flavors of UNIX®, while others were written specifically for AIX 7. The requirement is obtaining baseline data; the key data of a known environment on which you can base further tuning decisions.
The time to monitor your system is not when you get that ticket from the Help Desk complaining about poor performance. Data should be captured on your servers as soon as they are put into production. If you do this, you can be proactive in your tuning with the objective of actually finding the problem before the user points it out. How can you determine if the data they are looking at substantiates a performance issue without looking at data when the performance on the box was acceptable? This is all part of appropriate performance tuning methodology; capturing data effectively and properly analyzing the results and the trends. Let’s get on with it.
UNIX generic memory monitoring
In this section, we provide an overview of generic UNIX tools available on all UNIX distributions —ps, sar and vmstat. Most of these tools quickly allow you to troubleshoot a performance problem, but they are not really designed for historical trending and analysis.
Most administrators tend to shy away from ever using the ps command to troubleshoot a possible memory bottleneck. But ps does give you a significant amount of information about what is running on your machine, and therefore how your memory is being used. The most commonly used function of ps is to look at the processes running on your systems (see Listing 1 below).
Listing 1. Using ps to look at the processes running on your system
#ps ‑ef | more
UID         PID    PPID   C    STIME    TTY  TIME  CMD
root         1       0    0   Jul 30     ‑  0:01  /etc/init
root     1442014 3211408  0   Jul 30     ‑  0:00 /usr/sbin/snmpd
root     1638422 3211408  0   Jul 30     ‑  0:00 /usr/sbin/rsct/bin/IBM.DRMd
pconsole 1769544 5570756  0   Jul 30     ‑  1:53 /usr/java5/bin/java ‑Xmx512m ‑Xms20m
                                                  ‑Xscmx10m ‑Xshareclasses
                                                  ‑Dfile.encoding=UTF‑8
root     1900682    1     0   Jul 30     ‑  0:00 /usr/lib/errdemon
root     2031702    1     0   Jul 30     ‑  0:00 /usr/ccs/bin/shlap64
root     2097252    1     0   Jul 30     ‑  1:20 /usr/sbin/syncd 60
root     2162756 3211408  0   Jul 30     ‑  0:00 /usr/sbin/qdaemon
root     2556078    1     0   Jul 30     ‑  0:01 /opt/ibm/director/cimom/bin/tier1slp
root     2687168    1     0   Jul 30     ‑  0:25 cimserveroot     2752744 3211408  0   Jul 30     ‑  0:00 /opt/freeware/cimom/pegasus/bin/cimssys
                                                 platform_agent
root     2949134 3211408  0   Jul 30     ‑  0:00 /opt/freeware/cimom/pegasus/bin/cimssys
                                                  cimsys
root     3211408    1     0   Jul 30     ‑  0:00 /usr/sbin/srcmstr
root     3408036 3211408  0   Jul 30     ‑  0:00 /usr/sbin/sshd
root     3473482    1     0   Jul 30     ‑  1:14 /usr/bin/topasrec  ‑L ‑s 300 ‑R 1 ‑r 6
                                                 ‑o /etc/perf/daily/ ‑ypersistent=1 ‑O
                                                 type=bi
root     3539136    1     0   Jul 30     ‑  0:06 bin/nonstop_aix @config/
                                                 nonstop.properties
root     3670254 3211408  0   Jul 30     ‑  3:53 /usr/sbin/rsct/bin/rmcd ‑a
                                                 IBM.LPCommands ‑r
root     3735688   1      0  Jul 30      ‑  0:35 /opt/ibm/icc/cimom/bin/dirsnmpd
daemon   3801316 3211408  0  Jul 30      ‑  0:00 /usr/sbin/rpc.statd ‑d 0 ‑t 50
root     3866638 3211408  0  Jul 30      ‑  0:00 /usr/sbin/rpc.lockd ‑d 0
root     3932310 3211408  0  Jul 30      ‑  0:04 /usr/sbin/snmpmibd
root     3997880   1      0  Jul 30      ‑  0:00 /usr/sbin/uprintfd
root     4063408 3211408  0  Jul 30      ‑  0:00 /usr/sbin/inetd
root     4128912   1      0  Jul 30      ‑  0:00 /opt/freeware/cimom/pegasus/bin
                                                 /CIM_diagd
root     4260046 3539136  0  Jul 30      ‑  7:33 /var/opt/tivoli/ep/_jvm/jre/bin/java
                                                 ‑Xmx384m ‑Xminf0.01 ‑Xmaxf0.4 ‑Dsun.rmi
                                                 .dgc.cli
root     4325546   1      0  Jul 30      ‑  2:36 ./slp_srvreg ‑D
root     4391132 3211408  0  Jul 30      ‑  0:00 /usr/sbin/writesrv
root     4456636   1      1  Jul 30      ‑ 13:45 /usr/sbin/getty /dev/console
root     4522186 3211408  0  Jul 30      ‑  1:23 sendmail: accepting connections
root     4718632 3211408  0  Jul 30      ‑  0:50 /usr/sbin/aixmibd
root     4784288 3211408  0  Jul 30      ‑  6:03 /usr/sbin/syslogd
root     4849826 3211408  0  Jul 30      ‑  0:00 /usr/sbin/biod 6
root     4915382 3211408  0  Jul 30      ‑  0:05 /usr/sbin/hostmibd
root     4980920 3211408  0  Jul 30      ‑  0:05 /usr/sbin/portmap
root     5111980    1     0  Jul 30      ‑  0:00 /usr/dt/bin/dtlogin ‑daemon
root     5177510    1     0  Jul 30      ‑  0:07 /usr/sbin/cron
root     5243044    1     0  Jul 30      ‑  0:10 /usr/bin/cimlistener
root     5505206 3211408  0  Jul 30      ‑  0:00 /bin/ksh /pconsole/lwi/bin/
                                                 lwistart_src.sh
pconsole 5570756 5505206  0  Jul 30      ‑  0:00 /bin/ksh /pconsole/lwi/bin/
                                                 lwistart_src.sh
root     5701642 3211408  0  Jul 30      ‑  0:00 /usr/sbin/rsct/bin/IBM.ServiceRMd
root     6094978 7602204  11 09:16:46  pts/0 0:00 ps ‑ef
u0009539 6881324 7733258  0 08:09:42   pts/0 0:00 ‑ksh
root     7602204 6881324  0 08:09:45   pts/0 0:00 ‑ksh
u0009539 7733258 8126660  1 08:09:42      ‑  0:00 sshd: u0009539@pts/0
root     8126660 3408036  0 08:09:38      ‑  0:00 sshd: u0009539 [priv]
The most common output format for ps is not that useful for examining memory issues, but it can sometimes jog your memory about a process running on the system that you know uses a large amount of memory.
However, there are other output formats, the most useful of which is using the BSD style formats of u or v, which show specific memory usage reports for each process. The sample below shows you the memory usage for each active process running on your system, sorted in a nice format.
Listing 2. Memory usage for each active process
.
#ps gv | head ‑n 1; ps gv | egrep ‑v "RSS" | sort +6b ‑7 ‑n ‑r
  PID    TTY STAT  TIME PGIN  SIZE   RSS   LIM  TSIZ   TRS %CPU %MEM COMMAND
...lines skipped for clarity
4980920      ‑ A   0:05   14   972  1028 32768    41    56  0.0  0.0 /usr/sb
5111980      ‑ A   0:00   12   620   772 32768   135   152  0.0  0.0 /usr/dt
5177510      ‑ A   0:07   20   580   656 32768    58    76  0.0  0.0 /usr/sb
5243044      ‑ A   0:10    1  7176  7232 32768    34    56  0.0  0.0 /usr/bi
5505206      ‑ A   0:00    4   560   840 32768   241   280  0.0  0.0 /bin/ks
5570756      ‑ A   0:00    5   564   844 32768   241   280  0.0  0.0 /bin/ks
5701642      ‑ A   0:00  118  1772  1984    xx   258   212  0.0  0.0 /usr/sb
6881324  pts/0 A   0:00    0   556   836 32768   241   280  0.0  0.0 ‑ksh
7602204  pts/0 A   0:00    0   560   840 32768   241   280  0.0  0.0 ‑ksh
7667774  pts/0 A   0:00    0   720   828 32768    82   108  0.0  0.0 ps gv
7733258      ‑ A   0:00    0   828  1052 32768   450   556  0.0  0.0 sshd: u
8126660      ‑ A   0:00    0   704   928 32768   450   556  0.0  0.0 sshd: u
    264      ‑ A   1:20    0   448   448    xx     0     0  0.0  0.0 swapper
The different columns provide detailed information about the memory usage:
- RSS—The amount of RAM used for the text and data segments per process. PID 15256 is using 2888k. This is the real memory being used by the process.
- %MEM—The actual amount of the RSS / Total RAM. Processes using large percentages of memory should be examined further, although remember that database and HPC applications can use the entire memory block as normal and could be ignored. On a more general purpose system, any single process can use a lot of memory.
- TRS—The amount of RAM used for the text segment of a process in kilobytes.
- SIZE—The actual amount of paging space allocated for this process (text and data).
While this command provides useful information, we don’t usually start with this unless a trusted administrator has already diagnosed that there is a memory issue of some kind on the system. You should use vmstat to identify the cause of your bottleneck, even before you have determined that it might be memory related. vmstat reports back information about kernel threads, CPU activity, virtual memory, paging, blocked I/O disks, and related information (see Listing 3). It can be the quickest and dirtiest way of finding out what is going on.
Listing 3. Using vmstat to identify the cause of a bottleneck
#vmstat 1 4

System configuration: lcpu=4 mem=2048MB ent=0.25
kthr    memory              page              faults              cpu
‑‑‑‑‑ ‑‑‑‑‑‑‑‑‑‑‑ ‑‑‑‑‑‑‑‑‑‑‑‑‑‑‑‑‑‑‑‑‑‑‑‑ ‑‑‑‑‑‑‑‑‑‑‑‑ ‑‑‑‑‑‑‑‑‑‑‑‑‑‑‑‑‑‑‑‑‑‑‑
r  b   avm   fre  re  pi  po  fr   sr  cy  in   sy  cs us sy id wa    pc    ec
0  0 419100 30643  0   0   0   0    0   0  36  241 271  0  7 93  0  0.03  13.7
0  0 419100 30643  0   0   0   0    0   0  44   40 250  0  7 93  0  0.03  12.5
0  0 419100 30643  0   0   0   0    0   0  22  155 242  0  7 93  0  0.03  12.2
0  0 419101 30642  0   0   0   0    0   0  60   62 259  0  8 92  0  0.03  13.5
Let’s first define what the columns mean:
- Memory data avm—The amount of active virtual memory (in 4k pages) you are using, not including file pages. fre—The size of your memory free list. In most cases, we don’t worry when this is small, as AIX 7 loves using every last drop of memory and does not return it as fast as you might like. This setting is determined by the minfree parameter of the
vmocommand. At the end of the day, the paging information is more important. pi—Pages paged in from the paging space. po—>Pages paged out to the paging space. fr—Pages freed (replaced). sr—Pages scanned to determine if they need to be replaced. cy—Clock cycles used to scan pages for potential replacement. - CPU and I/O r—The average number of runnable kernel threads over the timing interval you have specified. b—The average number of kernel threads that are in the virtual memory waiting queue over your timing interval. If r is not higher than b, that is usually a symptom of a CPU problem, which could be caused by either an I/O or memory bottleneck. us—User time. sy—System time. id—Idle time. wa—Waiting on I/O. ec—The percentage of entitled capacity consumed, that is, on a system running on a shared processor, an indication of how much of the allocated CPU time you are using. rc—the percentage of shared processor resource that is consumed.
For a workload partition (WPAR), you should also be monitoring the WPAR specific memory utilization to understand whether your WPAR needs to be reconfigured. You can do this by using -@ command line argument specifying the WPAR name.
Let’s return to the vmstat output and what is wrong with your system. First a disclaimer: Please do not go to senior management with a detailed analysis and recommended tuning strategy based on a five-second vmstat output. You have to work a little harder before you can properly diagnosis the problems of your system. You should use vmstat when you have a production performance issue and need to know as soon as possible what is going on in your system. You’ll want to do this so that you can either alert people of what the problem might be or take immediate action if it is possible and appropriate.
With the output from vmstat, the primary thing to look at is the paging information. If there is a lot of paging out going on (po), this usually occurs when you are short of real memory and the VMM is sending pages of allocated memory out to disk to make room for pages from other processes to be paged in. Also, keep an eye on the I/O statistics, since blocked processes or high values on waiting on I/O (wa); it usually signifies either real I/O issues where you are waiting for file accesses or an I/O condition associated with paging due to a lack of memory on your system. In this case, it seems to be the latter. You are having VMM issues, which seem to be causing blocked processes and waiting on I/O condition. You might benefit by either tuning your memory parameters or possibly doing a dynamic LPAR (DLPAR) operation and adding more RAM to your LPAR.
Finally, if you are taking advantage of dynamic page sizes, then you should also monitor the page size allocation so that you can get a better understanding of how the different page sizes are being used. This can be useful to determine whether your page size and configuration are correct. You can get this information using vmstat -P ALL, as seen here in Listing 4.
Listing 4. Getting page size statistics
#vmstat ‑P ALL

System configuration: mem=2048MB

pgsz            memory                           page
‑‑‑‑‑ ‑‑‑‑‑‑‑‑‑‑‑‑‑‑‑‑‑‑‑‑‑‑‑‑‑‑ ‑‑‑‑‑‑‑‑‑‑‑‑‑‑‑‑‑‑‑‑‑‑‑‑‑‑‑‑‑‑‑‑‑‑‑‑
           siz      avm      fre    re    pi    po    fr     sr    cy
   4K   356160   266177    15406     0     0     0     0      0     0
  64K    10508     9509      999     0     0     0     0      0     0
The same rules apply here as to the general stats, low free pages, or high numbers of pageins/pageouts; all may indicate that your system is starved of memory.
Let’s drill down deeper. You can use the ps command that you looked at earlier to try to identify the offending processes. What we’d like to do at this point is run a sar to see if the condition continues to show with another tool. It is a good idea to use multiple tools to help further with the diagnosis to make sure it is right.
While we don’t like sar as much as other tools (you need too many flags and have to enter too many commands prior to diagnosing a problem), it allows you to collect data in real time and to view data that was previously captured (using sadc). Most of the older tools allow you to do one or the other. sar has been around for almost as long as UNIX itself, and everyone has used it at one time or the other. Use of the -r flag provides some VMM information (see Listing 5).
Listing 5. Using sar with the -r flag to obtain VMM information
#sar ‑r 1 4
AIX l488pp065_pub 1 7 00F604884C00    08/13/10

System configuration: lcpu=4 mem=2048MB ent=0.25 mode=Uncapped

10:28:32   slots cycle/s fault/s  odio/s
10:28:33  192470    0.00   26.41    0.00
10:28:34  192470    0.00    3.00    0.00
10:28:35  192470    0.00    3.00    0.00
10:28:36  192470    0.00    7.29    0.00

Average   192470       0      20       0
So what does this actually mean?
- cycle/s—Reports back the number of page replacement cycles per second.
- fault/s—Provides the number of page faults per second.
- slots—Provides the number of free pages on the paging spaces.
- odio/s—Provides the number of non paging disk I/Os per second.
You’re seeing a lot of page faults per second here but not much else. You’re also seeing that there are 1048052 4k pages available on your paging space, which comes out to 4GB. Time to drill down further using more specific AIX 7 tools.
Specific AIX 7 memory monitoring
In this section, we provide an overview of the specific AIX 7 tools available to you: svmon, topas, and nmon. Most of these tools allow you to troubleshoot a performance problem quickly and capture data for historical trending and analysis.
svmon is an analysis utility. It is used specifically for the VMM. It provides a lot of information, including real, virtual, and paging space memory used. The -G flag gives you a global view for memory utilization on your host (see Listing 6).
Listing 6. Using svmon with the -G flag
#svmon ‑G
size       inuse        free         pin     virtual   mmode memory
524288     492911      31377       329706     418311     Ded
pg space   196608       4137

               work        pers        clnt       other
pin          245850           0           0       83856
in use       418311           0       74600

PageSize     PoolSize     inuse        pgsp         pin     virtual
s    4 KB         ‑      340879        4137      195754      266279
m   64 KB         ‑        9502           0        8372        9502
The size reports back to total size of RAM in 4k pages, but also shows the statistics for individual page sizes. The inuse column reports back the pages in RAM used by processes, plus the number of persistent pages that belonged to a terminated process and is still resident in RAM. Free reports back the amount of pages on the free list. Pin reports back the number of pages pinned in physical memory (RAM). This cannot be paged out.
The paging space column reports back the actual use of paging space (in 4k pages). It’s important to make the distinction between this and what is reported back in vmstat. The vmstat avm column shows ALL the virtual memory that is accessed, even if it is not paged out. We also like to look at the working and persistent numbers. These parameters show the number of both the working and persistent pages in RAM.
Why is this important? As you might remember from Part 1, some of the differences between working and persistent storage were discussed. Computational memory is used while your processes are working on actual computation. They use working segments, which are temporary (transitory) and only exist up until the time a process terminates or the page is stolen. File memory uses persistent segments and have actual permanent storage location on the disk. Data files or executable programs are mapped to persistent segments rather than working segments. Given the alternative, you would much rather have file memory paged to disk than computational memory. In this situation, computational memory is unfortunately paged out more than file memory. Perhaps a little tuning of the vmo parameters might help shift the balance in your favor. Another useful feature of svmon is that you can display memory statistics for a given process. Listing 7 provides an example.
Listing 7. Using svmon to display memory statistics for a given process
#svmon ‑P 8126660
‑‑‑‑‑‑‑‑‑‑‑‑‑‑‑‑‑‑‑‑‑‑‑‑‑‑‑‑‑‑‑‑‑‑‑‑‑‑‑‑‑‑‑‑‑‑‑‑‑‑‑‑‑‑‑‑‑‑‑‑‑‑‑‑‑‑‑‑‑‑‑‑‑‑‑‑‑‑‑
     Pid Command          Inuse      Pin     Pgsp  Virtual 64‑bit Mthrd  16MB
 8126660 sshd             25818    11972        0    25677      N     N     N

     PageSize                Inuse        Pin       Pgsp    Virtual
     s    4 KB                 234          4          0         93
     m   64 KB                1599        748          0       1599

    Vsid      Esid Type Description              PSize  Inuse   Pin Pgsp Virtual
    9000         d work shared library text          m    809     0    0     809
    4002         0 work fork tree                    m    790   748    0     790
                   children=964bd8, 0
  804702         1 clnt code,/dev/hd2:214195         s    139     0    ‑       ‑
  8116a9         2 work process private             sm     62     4    0      62
                   parent=8075e2
  81f4ae         f work shared library data         sm     31     0    0      31
                   parent=823610
  83e05f         ‑ clnt /dev/hd2:111000              s      2     0    ‑       ‑
  81f54e         3 mmap maps 2 source(s)            sm      0     0    ‑
You can also use the ps -Z option to get the pagesize explicitly being used by different tools, as here in Listing 8.
Listing 8. Getting individual process page sizes
The columns show the data, stack, and text page sizes of each process. You can use this to determine which process need further exploration to determine their page size usage and allocation.
From here you can determine that this process is not using paging space (the Pgsp column), but you can see that it is using a combination of both 4KB and 64KB page sizes. The more detailed information shows exactly which parts of the application are using different page types of memory, with the PSize showing usage in different areas of small (4KB) and medium (64KB) pages. In this case, it’s difficult to see where we can get improvements in a shell server; but looking at another process, such as DB2 or Oracle, would be more valuable. Using the ps command discussed earlier, in conjunction with svmon, positions you to find the offending memory resource hog.
Let’s use something a little more user friendly—topas. topas is a nice little performance monitoring tool which can be used for a number of purposes (see Figure 1 below).
Figure 1. The topas tool
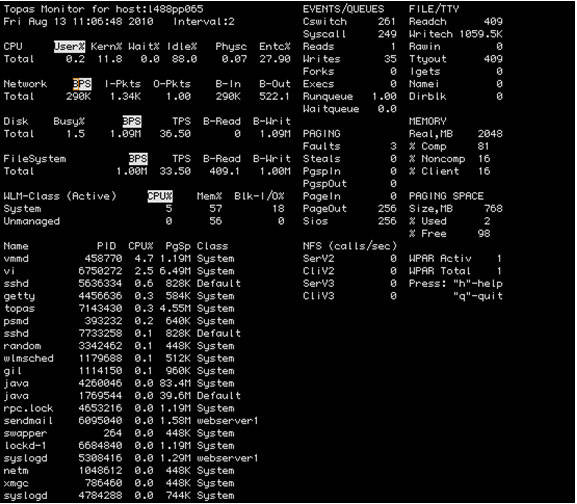
As you can see, running topas gives you a list of your process information, CPU, I/O, and VMM activity. From this view, you can see that there is very little paging space used on the system. We like to use this command for quickly troubleshooting an issue, especially when we want a little more than vmstat on my screen. We see topas as a graphical type of vmstat. With recent improvements, it now allows the ability to capture data for historical analysis.
Our favorite of all performance tools is actually a non-supported IBM tool called nmon. Similar in some respects to topas, the data that you collect from nmon is either available from your screen (similar to topas) or available through reports that you can capture for trending and analysis. What this tool provides that others simply do not is the ability to view pretty looking charts from a Microsoft® Excel spreadsheet, which can be handed off to senior management or other technical teams for further analysis. This is done with the use of yet another unsupported tool called the nmon analyzer, which provides the hooks into nmon. Figure 2 shows an example of the kind of output that one can expect from an nmon analysis.
Figure 2. nmon analysis output
There are many different types of nmon views you can see using this tool, which provide all sorts of CPU, I/O, and memory utilization information.
Summary
In this article, you looked at the various tools that are available to capture data for memory analysis on AIX 7. You also spent some time troubleshooting a system that had some performance problems that you were able to pin on virtual memory. We can’t reiterate enough that tuning is actually a small part of appropriate tuning methodology. Without capturing data and taking the time to properly analyze your system, you will be doing basically the same thing as a doctor throwing antibiotics at a sick patient without even examining him or her.
There are many different types of performance monitoring tools available to you. Some are tools that you can run from the command line to enable you to gauge quickly the health of your system. Some are more geared to long-term trending and analysis. Some tools even provide you with graphically formatted data that can be handed off to non-technical staff. Regardless of which tool you use, you must also spend the time learning about what the information really means. Don’t jump to conclusions based on a small sampling of data. Also, do not rely on only one tool. To substantiate your results, you really should look at a minimum of two tools while performing your analysis. We also briefly discussed tuning methodology and the importance of establishing a baseline while the system is behaving normally. After you examine your data and tune, you must continue to capture data and analyze the results of any changes that are made. Further, you should only make one change at a time, so you can really determine the effect of each individual change.
